Table of Contents
In the realm of restaurant management, harnessing the potential of visual insights through restaurant data visualization is becoming increasingly important.
In today’s fast-paced world, capturing attention and delivering information quickly is crucial.
Did you know that the human brain can process an image in just 13 milliseconds?
This fascinating fact highlights the power of visual information and its impact on our perception and understanding.
By transforming complex data into intuitive visual representations, restaurant owners and managers can gain a deeper understanding of their operations, make informed decisions, and drive meaningful improvements.
In this blog, we will explore the benefits and significance of restaurant data visualization, and how it can revolutionize management practices by providing clear, concise, and actionable visual insights.
Get ready to unlock the power of visuals and take your restaurant management to the next level.
What Is Data Visualization For Restaurants?
In the restaurant industry, data visualization refers to the visual representation of data to gain insights and improve decision-making processes.
By using data visualization in the restaurants industry, operators can quickly spot patterns, identify areas for improvement, and make data-driven decisions.
They can visualize sales trends, understand customer behavior, optimize menu offerings, and streamline operations.
Remember that data visualization empowers restaurant teams to easily interpret complex data and collaborate effectively, ultimately leading to improved efficiency, better customer experiences, and increased profitability.
How Did Restaurant Industry Work Without Data Visualizations?
Before the advent of data visualizations, the restaurant industry relied on traditional methods to analyze and interpret data.
These methods involved manual data entry, complex spreadsheets, and textual reports, which often posed challenges in understanding and extracting meaningful insights.
- Static Data
Restaurant owners and managers had to spend considerable time and effort in deciphering data, making it difficult to identify trends, patterns, and areas for improvement.
Without visual representations, the data remained static and could not convey information effectively.
- Slow Decision-Making Process
The absence of data visualisation also hindered the decision-making process.
Restaurant stakeholders had to rely on intuition, experience, and limited data analysis capabilities to make informed choices.
This approach could lead to subjective decisions and missed opportunities for optimizing operations, enhancing customer experiences, and maximizing profitability.
- Lack Of Communication
Additionally, the lack of visual insights made it challenging to communicate data-driven findings to teams and stakeholders.
Explaining complex data through lengthy reports or spreadsheets often resulted in information overload and reduced comprehension.
Overall, the restaurant industry without data visualisations faced limitations in data analysis, decision-making, and effective communication.
However, with the emergence of advanced visualization tools and techniques, restaurants now have the opportunity to leverage visual insights and transform their management practices for greater success.
How To Leverage Restaurant Data Visualization To Streamline Management

In today’s data-driven world, leveraging data visualization has become increasingly important for streamlining restaurant management.
By transforming complex data into visual insights, restaurant operators can make more informed decisions, enhance operational efficiency, and drive business growth.
Here are five key ways to leverage restaurant data visualization in restaurant management.
1- Real-time Performance Monitoring
Data visualization tools provide real-time monitoring of key performance indicators (KPIs) such as sales, revenue, customer feedback, and operational metrics.
Through intuitive visual dashboards, managers can track these KPIs, identify trends, and spot any issues that require immediate attention.
Real-time visual data empowers managers to make timely adjustments to improve performance, such as implementing targeted promotions or addressing service bottlenecks.
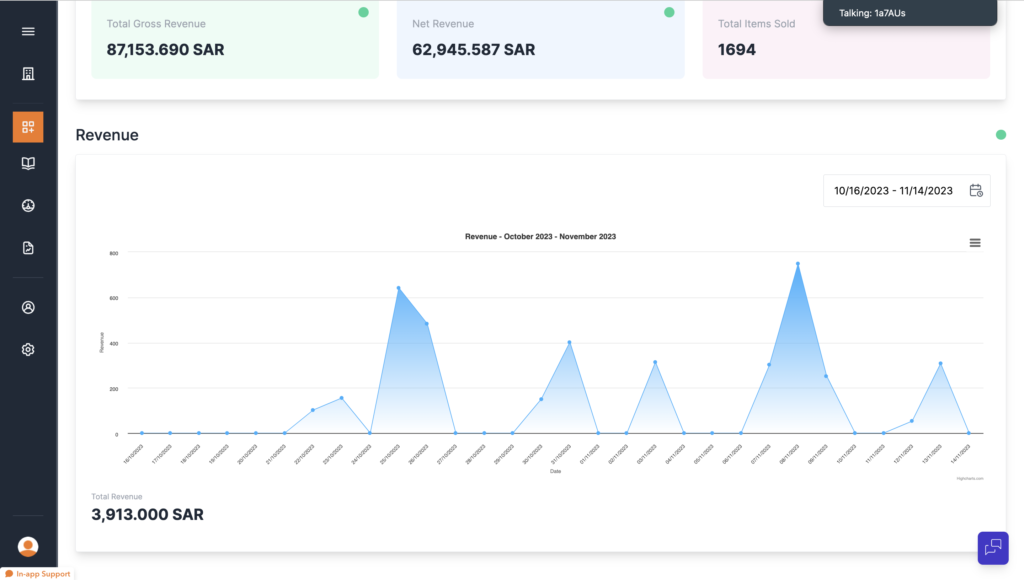
With jalebi’s robust reporting feature, restaurants gain access to real-time data insights that drive informed decision-making.
The reporting feature provides comprehensive analytics and visualizations of key performance indicators (KPIs) such as sales, inventory, labor costs, and customer feedback to help restaurants make the right decisions.
2- Menu Optimization
Visualizing menu performance data helps restaurants identify popular and underperforming items.
By analyzing customer preferences, sales trends, and profitability, operators can optimize their menu offerings.
Data visualizations enable them to make data-driven decisions regarding pricing, ingredient choices, portion sizes, and menu promotions.
This level of menu optimization maximizes profitability, minimizes waste, and enhances customer satisfaction by aligning the menu with customer preferences and market demands.
When it comes to updating your menu quickly and efficiently based on customer preferences, jalebi’s restaurant management platform is the go-to software for your restaurant.
With jalebi, you can easily make changes to your menu items, add new dishes, or remove unpopular ones with just a few clicks.
3- Inventory Management
Data visualizations play a vital role in efficient inventory management.
By visualizing inventory levels, ordering patterns, and usage trends, restaurant operators can ensure optimal stock levels and minimize waste.
Visual representations of inventory data help identify slow-moving items, prevent stockouts, and streamline ordering processes.
With clear visual insights, managers can make informed decisions about inventory replenishment, vendor selection, and cost-effective storage solutions.
Jalebi’s restaurant management platform provides robust inventory management capabilities that allow you to keep track of your stock levels, monitor ingredient usage, and place orders seamlessly.
By leveraging jalebi’s real-time inventory management system, you can ensure that you have the right amount of ingredients on hand at all times, preventing stockouts or excess inventory.
4- Customer Insights
Restaurant data visualization enables restaurants to gain valuable insights into customer behavior and preferences.
By visualizing customer data, such as demographics, purchase history, feedback, and loyalty program engagement, operators can understand their target audience better.
Visual representations of customer insights help identify patterns, preferences, and trends. This information helps in personalizing marketing campaigns, tailoring menu offerings, and improving overall customer experiences.
By visualizing customer feedback and sentiment analysis, managers can quickly identify areas for improvement and take proactive steps to address them.
5- Staff Performance and Scheduling
Visualizing staff performance metrics, such as sales per hour or customer satisfaction ratings, allows restaurant managers to identify top-performing employees and areas for improvement.
Restaurant data visualizations also assist in creating optimized staff schedules based on historical data, demand forecasts, and labor cost considerations.
By visually analyzing staff performance and scheduling data, managers can optimize labor allocation, ensure sufficient coverage during peak hours, and minimize labor costs while maintaining high-quality service.
When it comes to managing staff performance and scheduling, jalebi serves as an excellent data visualization platform.
With jalebi’s intuitive data visualization capabilities, you can transform complex data into meaningful graphical visualizations that provide valuable insights into your staff’s performance, productivity, and scheduling needs.
By leveraging data visualization tools and techniques, restaurant operators can transform raw data into actionable insights.
This empowers them to make data-driven decisions, streamline operations, enhance customer experiences, and drive profitability in today’s competitive restaurant industry.
With visually appealing and easily understandable data insights, restaurant managers can stay ahead of the curve and make informed decisions to maximize their business potential.
Restaurant data challenges
Time-Consuming Data
Running a restaurant demands time and attention to detail. Unfortunately, manual data management can be a significant time sink. Manually inputting data, reconciling information, and generating reports can take hours, shifting focus from what matters most—providing an exceptional dining experience.
Scattered Data Sets
One of the most significant challenges restaurants face is dealing with data scattered across various platforms. From POS systems and inventory management to customer feedback and employee schedules, managing disparate data sets can be a nightmare. But when you own an all-in-one restaurant operating system, such as jalebi, it will act as a central hub, integrating seamlessly with multiple systems, allowing you to access all your data in one place.
Not User-Friendly Interfaces
In a world where time is money, a non-intuitive interface can hinder productivity. Traditional systems often come with a steep learning curve, leading to frustration among staff members.
Poor Data Visualization
Data is only as valuable as your ability to interpret it. Poor data visualization can make it challenging to extract meaningful insights. This doesn’t need to be in certain charts like pie, line, bar ..etc, whatever format that is aligned with the nature of data and restaurant’s goals would work.
Not Real-Time Enough
In the restaurant industry, staying ahead of the curve often means having access to real-time data. Traditional systems may fall short in delivering information promptly, leaving you playing catch-up.
Examples of restaurant data sets
1. Sales By Menu Item
this dataset provides a breakdown of sales for each menu item during a specific period. It includes the quantity sold and the revenue generated by each dish. Analyzing sales by menu item helps restaurant owners identify popular dishes, optimize menu offerings, and make informed decisions about pricing and promotions.
A restaurant might use this data to determine which items contribute most to overall revenue, allowing them to focus marketing efforts on high-performing dishes or strategically adjust menu prices.
2. Delivery Service Analysis
his dataset focuses on the performance of the restaurant’s delivery service. It includes metrics such as delivery times, customer satisfaction ratings for delivered orders, and the frequency of delivery orders. This data is crucial for assessing the efficiency of the delivery operation and ensuring a positive customer experience.
With delivery service analysis, a restaurant can identify areas for improvement in delivery times, assess the popularity of delivery options, and make strategic decisions about partnering with third-party delivery services.
3. Week To Date Top Sellers
This dataset highlights the top-selling menu items within the current week. It provides real-time information about the most popular dishes, allowing restaurant managers to adjust inventory levels, optimize kitchen operations, and capitalize on customer preferences.
By regularly reviewing week-to-date top sellers, a restaurant can adapt its offerings to meet changing customer tastes, promote high-performing items, and ensure that sufficient ingredients are on hand to meet demand.
4. Net Sales Data
Net sales data provides a comprehensive overview of a restaurant’s revenue after accounting for discounts, returns, and any other deductions. It includes total sales figures, net revenue, and a breakdown of sales by category (e.g., dine-in, takeout, delivery).
This dataset is vital for financial analysis, helping restaurant owners assess overall business performance, track revenue trends, and make informed decisions about budgeting, pricing, and resource allocation.
These examples represent just a snapshot of the diverse data sets that restaurants can leverage to enhance their operations. By harnessing such data, restaurant owners and operators can gain valuable insights into customer behavior, operational efficiency, and overall business performance, ultimately leading to more informed decision-making and improved profitability.
Partner With jalebi To Improve Restaurant Management With Visualizations
What if you had a secret weapon that could unlock the power of data and transform it into visually captivating insights?
Enter jalebi, the game-changing restaurant management platform that unleashes the potential of data visualizations.
With jalebi by your side, you can revolutionize the way you manage your restaurant by harnessing the power of visual representations.
- Streamlining Operations with Real-time Insights
jalebi’s data visualization capabilities provide real-time insights into crucial operational metrics.
From sales performance and customer feedback to inventory levels and staff productivity, visually appealing charts and graphs enable restaurant managers to identify trends, spot bottlenecks, and optimize operations on the fly.
- Enhancing Menu Planning and Optimization
Visualizing data related to menu items, customer preferences, and sales trends allows restaurants to make data-driven decisions when it comes to menu planning and optimization.
jalebi’s visualizations empower restaurants to analyze the popularity of specific dishes, identify top-selling items, and adjust the menu accordingly to meet customer demands and maximize profitability.
- Enhancing Customer Experience
Data visualizations can also play a crucial role in understanding and improving the customer experience.
jalebi enables restaurants to visualize customer feedback, ratings, and reviews, providing valuable insights into areas where improvements can be made.
By identifying customer preferences and trends, restaurants can personalize their offerings and deliver an exceptional dining experience.
Final Thoughts
In an era where data is generated at an unprecedented rate, harnessing the power of this vast information is key to staying ahead in the competitive restaurant industry.
The staggering growth of data is evident as we generated 2.5 quintillion data bytes per day in 2020, and by 2025, this number is projected to skyrocket to a mind-boggling 463 exabytes of data per day.
It is clear that the ability to effectively analyze and visualize this data will be instrumental in making informed business decisions.
With jalebi’s powerful data visualization capabilities, restaurants can unlock the true potential of their data, gain valuable insights, and navigate the complexities of the industry with confidence.
Contact us today for more information and details!
Frequently Asked Questions
- How performance management may be improved by providing managers with data visualizations?
Providing managers with data visualizations can greatly enhance performance management in several ways.
Firstly, data visualizations offer a clear and concise representation of key performance metrics, allowing managers to quickly identify trends, patterns, and anomalies.
By having access to visual representations of data, managers can easily spot areas of improvement or potential issues that need to be addressed. This enables them to make data-driven decisions and take timely actions to optimize performance.
Additionally, data visualizations simplify complex data sets, making it easier for managers to understand and communicate insights to their teams.
Visual representations can also facilitate the identification of correlations and relationships between different variables, leading to a deeper understanding of performance drivers.
Overall, data visualizations empower managers with actionable insights and enable them to monitor, analyze, and improve performance more effectively.
- How do restaurants capture customer data?
Restaurants capture customer data through various methods, primarily aimed at enhancing the customer experience, improving service, and driving business growth.
One common approach is the use of customer loyalty programs or membership cards, which allow restaurants to gather information such as names, contact details, dining preferences, and visit history.
By offering incentives, discounts, or personalized promotions through these programs, restaurants encourage customers to provide their data willingly.
Moreover, many restaurants have adopted digital solutions, such as mobile applications or online reservation systems, which enable them to collect data directly from customers.
These platforms can capture information like demographics, dining preferences, feedback, and reviews.